In the ever-evolving digital landscape, capturing your audience’s attention is both an art and a science. While blog posts offer depth and detail, infographics provide a visually engaging and digestible way to share information. What if you could seamlessly transform your written content into compelling visuals without starting from scratch? Enter artificial intelligence-a powerful ally that bridges creativity and efficiency. This article explores how to harness AI tools to turn your blog content into striking infographics, making your message not only heard but vividly seen.
Table of Contents
- How AI Transforms Written Content into Engaging Visual Narratives
- Key Techniques for Selecting and Structuring Blog Data for Infographic Design
- Optimizing AI Tools to Enhance Clarity and Aesthetic Appeal in Infographics
- Q&A
- Insights and Conclusions

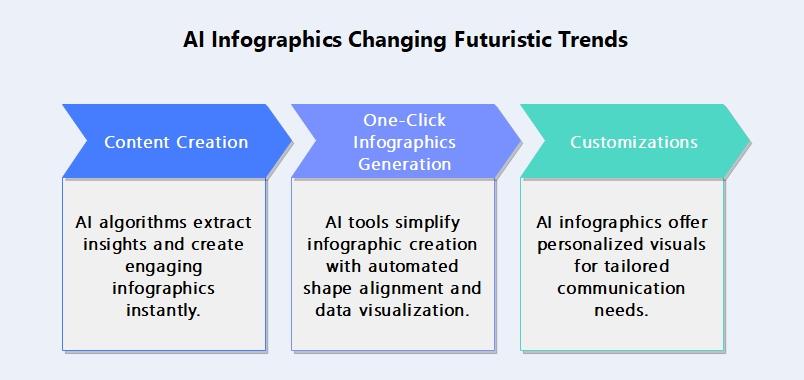
How AI Transforms Written Content into Engaging Visual Narratives
AI-powered tools revolutionize the way written content is transformed into captivating visual stories by analyzing text to identify key points, themes, and data. Using natural language processing, these tools pinpoint essential information and automatically suggest visual elements like icons, charts, and color schemes that resonate with the blog’s message. This process not only enhances user engagement but also ensures clarity and retention through thoughtfully designed infographics. Key features include:
- Automatic Data Extraction: Extracts statistics and essential facts seamlessly.
- Visual Customization: Offers style and layout options aligned with brand identity.
- Interactive Elements: Incorporates animations or clickable data points.
| Feature | Benefit | Example |
|---|---|---|
| Text Summarization | Creates concise narratives | Highlighting blog’s main ideas |
| Icon Recommendations | Visual clarity enhancement | Relevant symbols matching content |
| Color Palette Selection | Psychological impact boost | Brand-consistent visual harmony |
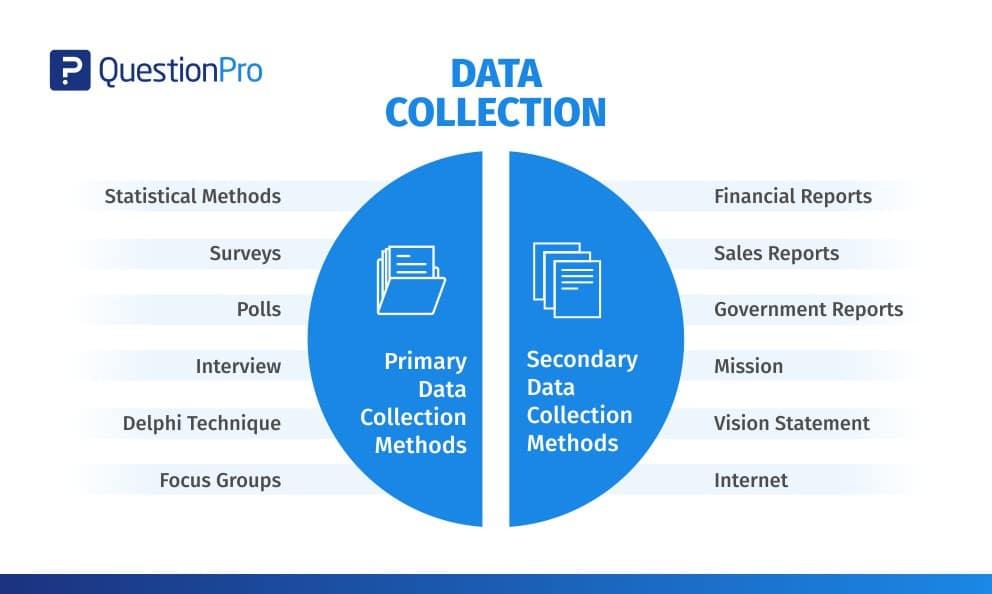
Key Techniques for Selecting and Structuring Blog Data for Infographic Design
To create compelling infographics from blog content, start by extracting the most impactful data such as statistics, quotes, and key facts. Focus on clarity by breaking down complex information into bite-sized pieces, making it easier for AI tools to identify visual opportunities. Use structured lists or headings within your blog to organize content hierarchically; this helps AI analyze relationships between data points and design logical visual flows. Incorporate categorical labels and keywords to guide AI in grouping similar concepts or themes effectively. Remember to balance quantitative data (numbers, percentages) with qualitative insights (short narratives, conclusions) to create an engaging, informative, and visually diverse infographic.
- Highlight statistics and data points that tell a story.
- Utilize clear headings and subheadings for better AI parsing.
- Tag content with relevant keywords or categories.
- Break information into concise bullet points or short paragraphs.
- Mix numbers with brief, meaningful commentary to add context.
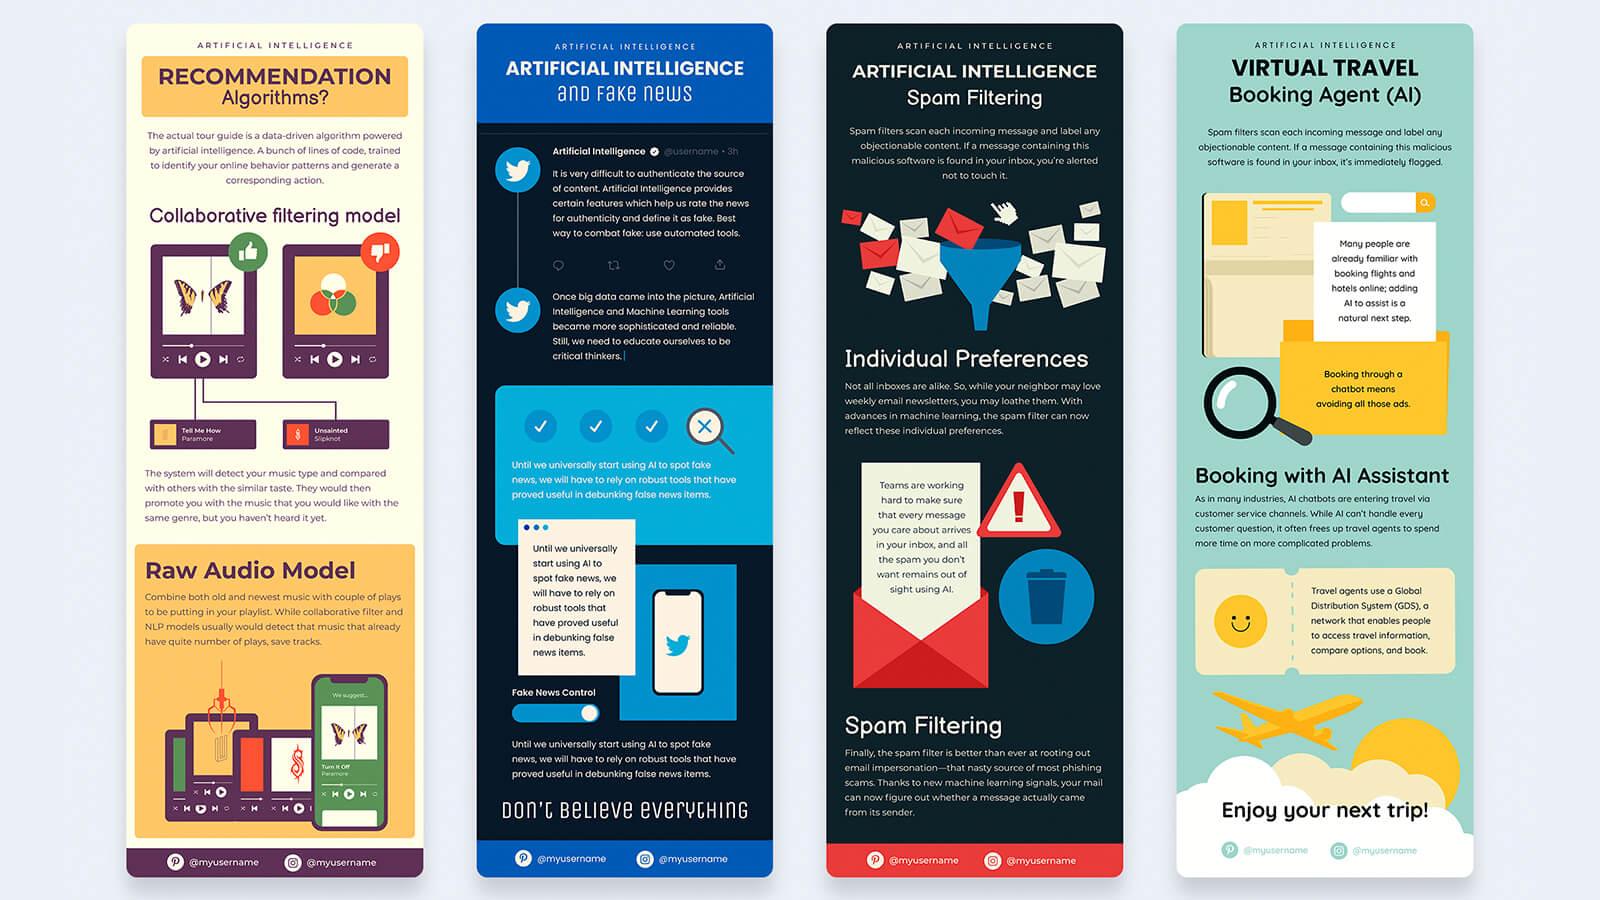
Optimizing AI Tools to Enhance Clarity and Aesthetic Appeal in Infographics
To elevate your infographic’s impact, leverage AI tools that specialize in data visualization, color theory, and layout design. Start by feeding your blog content into AI platforms that can identify key points and transform complex text into digestible visuals. Utilize AI’s capability to suggest harmonious color palettes tailored to your brand identity, ensuring readability and aesthetic balance. Don’t forget the power of automated formatting options-AI can arrange elements to maintain a clear flow and logical hierarchy, making your infographic both attractive and easy to understand. The AI-driven approach also enables quick iterations, allowing you to experiment with multiple design variations before settling on one that amplifies your message with clarity and style.
| AI Feature | Benefit | Impact on Infographics |
|---|---|---|
| Text Summarization | Extracts core ideas | Simplifies complex content |
| Color Palette Generator | Creates cohesive schemes | Enhances visual harmony |
| Layout Optimization | Rearranges elements smartly | Improves content flow |
- Prioritize clarity: Let AI help highlight essential information.
- Balance design: Combine AI’s color and font suggestions for aesthetics.
- Iterate quickly: Use AI to explore various styles without starting from scratch.
Q&A
Q: What are the benefits of turning blog content into infographics using AI?
A: Using AI to convert blog content into infographics saves time, boosts visual appeal, and enhances information retention. AI tools can quickly analyze text, identify key points, and design engaging visuals, making complex data easier to digest.
Q: Which AI tools are best suited for creating infographics from blog content?
A: Popular AI-powered tools include Canva’s Magic Design, Visme’s AI assistant, and Piktochart’s AI features. These platforms use natural language processing and design algorithms to transform written content into polished infographics effortlessly.
Q: How does AI understand which parts of a blog to highlight in an infographic?
A: AI uses natural language processing to analyze the text, extracting main ideas, statistics, and keywords. It prioritizes information based on relevance and clarity, ensuring the infographic focuses on the most important points.
Q: Can AI generate completely customized infographic designs based on my blog’s theme?
A: Yes, many AI tools adapt design elements such as color schemes, icons, and layouts to match the blog’s theme or branding guidelines, creating cohesive and visually consistent infographics tailored to your style.
Q: Are there limitations to using AI for infographic creation?
A: While AI excels at summarizing and designing, it may sometimes oversimplify complex topics or miss nuanced context. Human review and editing remain essential to ensure accuracy, tone, and message clarity.
Q: How can I maximize engagement with AI-generated infographics?
A: Pair infographics with compelling headlines, share them on social media, embed them in blogs, and include clear calls to action. AI tools often provide optimization tips to enhance shareability and viewer interaction.
Q: What steps should I follow to turn my blog content into an infographic using AI?
A: Start by inputting your blog text into an AI infographic tool, select preferred design styles, let the AI generate the visual summary, then customize colors or icons as needed. Finally, review and publish your infographic across platforms.
Q: Is it necessary to have design skills to use AI for making infographics?
A: No, AI tools are designed to be user-friendly, requiring minimal design knowledge. They automate layout, color matching, and iconography, allowing anyone to create professional-looking infographics with ease.
Insights and Conclusions
In a digital landscape where attention spans are fleeting and visuals speak louder than words, harnessing AI to transform your blog content into compelling infographics is more than just a trend-it’s a strategic evolution. By blending the nuance of your written insights with the clarity of vibrant visuals, AI empowers you to communicate complex ideas swiftly and memorably. Whether you’re a seasoned content creator or just beginning to explore the potential of data storytelling, integrating AI-driven infographic tools offers a fresh avenue to engage, inform, and inspire your audience. As technology continues to advance, embracing these innovations ensures your message not only reaches readers but resonates deeply-and visually-long after the first glance.